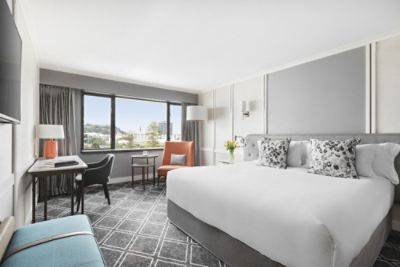
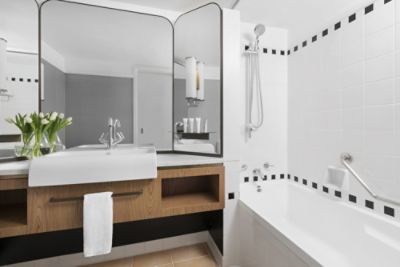
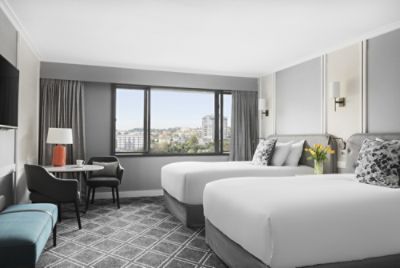
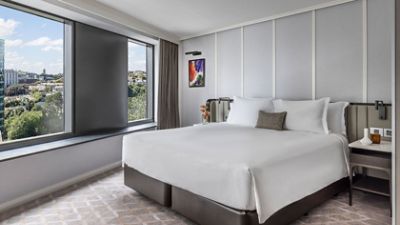
The case for milk

Humans are the only species that habitually consume milk and milk products from other species, which amounts to almost 800 billion litres every year. Cows’ milk is the most consumed, but other options are milk from buffalo, goat, sheep, and donkey, to name only a few.

Cows generally prefer a temperate climate but in hotter climates are reared at higher altitudes or housed in air-conditioned accommodation, in order to provide a fresh milk supply. Milk reconstituted from powder is an important option in non-milk producing locations. Distinguishing between fresh and reconstituted milk is an important challenge for the analyst, especially where fresh milk commands a premium price.

There are some parts of the world where milk was not widely consumed, although the convenience factor and wider availability of UHT milk is also changing this.

Milk composition

Foods composition tables show that cow’s milk contains a wide range of nutrients. Such tables are useful for obtaining nutritional information on most of the foods that we consume. However, one drawback is that they only report average values and do not account for variations in composition arising from season, diet, breed of cow and stage of lactation. As an example, Chen et al. (2014) reported variations in composition and properties of bulk milk collected on 25 occasions over a complete year. A selection of data is shown in Table 1, which includes the mean value and the range found for pH and the main components in milk. It needs to be more fully appreciated that milk, being of biological origin, is variable in composition. There is potential for employing variations of raw milk to make “best use “ of milk and this is starting to receive more attention ( Chen et al., 2017a, 2017b)

Production and use

The top four bovine milk producers in the world are the US, India, China and Brazil. Table 2 shows some of the major milk producers worldwide and also their populations. The amount of milk produced per head of population has been calculated and this reveals who is producing surplus to national requirements and those countries which are not, ie, the major exporters and importers of milk products.

The situation in the UK is worth further discussion. We are approximately the tenth largest milk producer in the world and we consume about 50 per cent of this as liquid milk. This is the highest in the world and the vast majority of this is pasteurised. In the US it is approximately 20 per cent and in Ireland about 10 per cent. Thus we are the foremost nation of milk drinkers.

Options for using milk are relatively simple. The simplest is to consume it as liquid milk, or it can be converted it into a range of products. In the UK, cheese production accounts for about 30 per cent of the milk produced. The main by-product is whey. Industries have evolved to utilise whey and this is a now a valuable revenue stream for cheese manufacturers and whey processing specialists. It takes about 10 kg milk to make 1 kg of a hard cheese like cheddar, which will generate about 9 kg of liquid whey. Whey protein concentrates and isolates are widely available for a wide variety of health related uses, including sports nutrition.

Milk composition can be easily modified by physical separation processes. The fat in milk can separated by centrifugation and recombined with skim milk to produce milk with a variety of fat contents and creams ranging from 12 per cent to upward of 50 per cent. Protein may also be concentrated by ultrafiltration for high protein drinks.

In recent times, semi-skimmed milk has become popular. Its fat content has been reduced from about four per cent to about 1.5 per cent but it retains a reasonable mouthfeel. Skim milk, which contains about 0.1 per cent fat, is also a popular option, but it has a more watery mouthfeel. However, the mineral and water soluble vitamin contents of both these reduced-fat milks is approximately the same as the original milk.

Heat treatment

Milk is usually heat treated, primarily to make it safe for consumption. In the UK it is predominantly pasteurised. This is the simplest way to use milk and we do this exceptionally well in the UK.

Heat treatment ranges from pasteurisation and extended shelf-life, which both require refrigerated storage, through to sterilisation. Again sterilisation can be performed in the container at 115 -120 oC for 15 to 30 min or by ultra-high temperature (UHT) processing. This involves heating product up to 140 oC and holding it at that temperature for a short period of time. It is then cooled and packaged aseptically, to maintain it sterile. In the UK, most milk is pasteurised and distributed and stored chilled. In contrast, in France and Belgium, over 90 per cent of liquid milk is UHT processed.

Sterilisation provides a product that can be stored without refrigeration and which may have a shelf-life of six months or longer. Most of the plant protein beverages are UHT sterilised.

Worldwide, white milk still dominates the dairy beverages sector. In 2015, 216 billion litres were consumed. In contrast, soya milk was 17.8 billion litres and the emerging RNGS (rice, nuts, grain and seeds) category was 8.3 billion litres. In a recent article it was stated that there are over 15 products in this latter category. The most common are almond, coconut, oats and rice. All of this is heat treated.

Nutrients

Milk contains an essential range of minerals and vitamins. When milk is converted to products, the aim is to ensure that the nutrients that are found in milk are retained in the products.

Milk provides a very cheap source of protein, something which should be more widely appreciated. Table 3 has been compiled by purchasing products in a local supermarket. The cost of the purchase, its weight or volume and its declared protein content allow the cost of purchasing one gram of protein to be calculated. The table contains the approximate price we pay for protein for a variety of popular products in the UK diet. It shows that those two staples of the English diet, namely bread and milk, are the cheapest protein sources and eggs are not far behind.

Many nutritional studies show that people are more likely to benefit from including milk and milk products in their diet than excluding them. At one time free school milk was supplied to every child in the UK, and at that time childhood obesity was not the problem that it now is. Some things which are of current concern are increases in obesity and Type 2 diabetes. Rickets is also on the increase. One of the main problems in the elderly is muscle wastage. Protein and calcium are very important nutrients to reduce this.

Milk intolerances

A small proportion of the population may show intolerance to milk. However, it is often considered to be more of a perceived problem than a real problem. It is estimated that only 0.01 per cent of Northern European populations lacks the enzyme to digest lactose.

“Almost 12 million people in the UK consider themselves to be lactose intolerant” ( Bee, 2016). For many Britains, milk phobia has little medical basis. Formally diagnosed problems are a fraction of the figure who think they have a problem. More common is secondary lactose intolerance, which is temporary and might occur after a bout of illness. There are some strategies for tolerating dairy products and it is accepted that people can also learn to tolerate lactose

Breast milk is the first food to be naturally available to babies. It has had an eternity to evolve in order to provide adequate nutrition at the start of life. Infant formulations aim to mimic breast milk in composition. It is an undisputable fact that breast milk contains more lactose than bovine milk. From this, one might assume that all infants are born with the ability to digest lactose, but in many parts of the world, lactose intolerance is widespread. One explanation is that the ability to digest lactose is easily lost quite quickly in some populations and it is not clear (to me) why this is the case.

Some people may be intolerant to protein, the most common and fashionable at the moment being gluten (wheat protein) intolerance. The main protein fraction in milk is casein, but there are different types of casein. One casein fraction is β-casein and most bovine milk contains both A1 and A2 forms of β–casein. Some individuals may be intolerant to A1 β-casein and this can be overcome by consuming milk containing only the A2 B-casein milk. Such milk is available and sold as A2 milk. In Australia, about 10 per cent of milk consumed is A2 milk. Such A2 milk is now available in the UK, but is in its infancy, with about two million litres a year being consumed. It is still milk with nothing added, as the cows have been selected to produce milk containing only the A2 variant of β-casein. Another strategy is to switch from cow’s milk to goat’s or sheep, buffalo or donkey, depending on where you are living.

Another interesting development is the availability of melatonin milk in Ireland (Lullaby milk). Melatonin is a natural sleep-inducing hormone and cows which are milked at night time produce milk containing higher amounts of melatonin, thus providing a natural sleeping potion. It is well known that milky drinks consumed before bedtime help many people to sleep well, but there has not been any scientific basis for this.

Internet and social networking

The internet is now a very important source of information about food and nutrition. However, it is not only an excellent means of disseminating information, but also disinformation. In the political world, the term “fake news” is applied, but false information also abounds about milk and milk products. Unlike scientific literature it is not regulated, scrutinised and subject to peer review.

Through the internet and social networking, there is a worrying movement aimed toward removing milk and milk products from our diet and replacing them with a range of products. One category that might appear to be in direct competition are plant protein beverages, such as soya, almond, coconut, rice and oat products. It is important to question why this is happening and the wisdom of such advice. Some information about the cost of purchasing protein from these drinks is shown in Table 3.

There is nothing inherently wrong with these products and as part of a balanced diet they provide variety. However, many of them are very low in protein and in some other important nutrients and provide an expensive means of providing protein to the diet. Thus they should not be considered as substitutes for milk. For example, protein from a coconut beverage is almost 70 times more expensive than that from milk.

There may also be intolerances to many of the plant protein beverages. Many of them provide allergen advice. For example, the main component of soymilk, which is the soybean, is a declared allergen on the label. Many people have severe allergies to some nut products. In almond drinks, the main ingredient is listed (in bold) as an allergen and in oats, gluten is listed as allergen. Rice and coconut beverages list no allergens, but there will inevitably be some people who will be allergic to these products.

Reasons for milk

A person giving up dairy products or thinking about doing so should seriously consider their reasons for taking this course of action. It should be monitored in some objective way as to whether it is improving their health and wellbeing, especially if they are going to advocate that others follow their example. Between the age of 10 and 20, bone mass increase is at its maximum. Unfortunately, failure to achieve adequate bone mass at this time may only become evident 20 to 30 years later, when osteoporosis may set in. Calcium and vitamin D are two important nutrient requirements at this stage of life. Dairy products will provide the calcium, and outdoor living and sunshine the vitamin D.

If it is because the dairy substitute product is providing the person with a cheaper and better source of protein, then this is not correct. The cost of protein is considerably higher in coconut and rice beverages, compared to cow’s milk, and there is less information about protein quality and anti-nutritional compounds in these other products. As a strategy for consuming alternative protein sources, this is an expensive and impractical solution. Further, the person may well be allergic to some of the proteins in these products, or they may contain other dietary allergens or irritants.

It may be because the person considers them to be more natural than milk. In fact the reverse is true. They are usually fortified with minerals and vitamins. Therefore, if a person is one of the “ anti-additive” brigade and switches from milk to these beverages, then wires have really been crossed. Dairy milk can be labelled as milk and nothing else, while the first ingredient declared on most of these plant beverages is water.

The fact that milk has no added water can be verified by its freezing point, which is consistently about -0.52ºC across the world. In a recent survey the freezing point of 14 different soymilks on the UK market ranged between -0.09ºC down to -0.65ºC. In beverages, the freezing point reflects the amounts of small molecules in the product, eg, sugars, salts and vitamins. This wide range found for the freezing point of soymilk reflects large variations in its composition. Its freezing point will depend upon the soybean source and the amounts of other additives. So, when buying soymilk, its composition is going to be much more variable than that of cow’s milk.

If the concern is that milk is heat treated, then so are all these other plant protein beverages. In fact most plant protein beverages are UHT processed. In contrast, most milk in the UK is pasteurised and is consumed within seven to 10 days.

Milk is a very important source of minerals, especially calcium. However, it is much less appreciated that calcium in milk from different species varies. Human milk contains about 7.5 mM calcium, cow’s and goat milk about 30 mM, sheep milk about 50 mM and some animals such as bears contain over 100 mM.

The content of calcium and some other minerals of feed materials used in plant protein beverages are also given in Table 4. These are presented on a dry weight basis (ie, in powdered form) to help to make comparisons. This shows that most of the raw materials used for plant protein beverages contain much less calcium than milk. Thus when they are used to produce beverages, they need to be fortified with calcium, which is another additive. It is interesting that calcium is fortified to levels found in bovine milk, and not to levels found in human milk.

Most plant protein beverages contain added sugar. Some of these are not very palatable without added sugar and sugar may be added as fruit juices in some products. Recent health guidelines recommend that no more than five per cent of our calories should be derived from added sugar.

Some confusion is evident about how the plant protein beverages are described, and for some the term milk is applied, especially for soy products. It is curious that they wish to use “milk” as a descriptor. Where it is used as marketing tool, it suggests that there is a grudging respect for those attributes of milk that are considered worthy of emulating. But rather than buy a product that would like to be milk, why not consume the real thing?

According to information provided on the labels, most plant protein beverages are not suitable for consumption by babies and infants. Why ever not? Some typical labelling advice is that they are not suitable for children under two years old or that they can be introduced as part of a balanced diet from six months of age, or that they are suitable as a main milk alternative from two years.

They also have very different ratios of K /Na to milk and also to bodily tissue, which may also be an important issue.

The main ingredient in plant protein beverages is water. Water itself is not just water, as it may contain variable amounts of minerals. For some products, water quality is crucial to product quality. For example, in brewing and beer production the water is “Burtonised” to modify its mineral content to that found in water from Burton on Trent. To date, I have seen no mention of the role of added water quality and composition of these products.

Conclusions

Milk and milk products are facing a hostile assault on-line. Often, much of this is pure science fiction. For example it does not appear in the alkaline diet, while it is closer to being alkaline than most foods recommended on that diet.

One should look closely at those who advocate and practice a dairy-free diet and judge whether they both are and look healthy and at the science underpinning their hostility to milk.

Like all foods, plant protein beverages are produced to be enjoyed. However, they are expensive ways to purchase water and protein and they are usually fortified with calcium, minerals and vitamins. Thus, they are much less natural than milk. Many profess to contain allergens and some are not suitable for babies and younger children. One should think very carefully about using these exclusively to replace milk from the diet. Some of the possible adverse effects may take a long time to be noticed. Replacing something natural with something that is not natural is not a logical thing to do.

There is increasing evidence that increased milk consumption will decrease risk factors associated with coronary heart disease, artereal stiffness, type 2 diabetes, rickets and even colorectol cancer. There is no such evidence yet for plant protein beverages.

References

Bee, Peta, What’s wrong with milk from a cow?. The Times, April 26th, 2016

Chen, B., Lewis, M.J. and Grandison, A.S. (2014), Effect of seasonal variation on the composition and properties of raw milk destined for processing in the UK, Food Chemistry, 158, 216-223.

Chen, B.Y., Grandison, A.S. and Lewis, M.J. (2017) Best use for milk – A Review I-Effect of breed variations on the physicochemical properties of bovine milk. International Journal of Dairy Technology, 70-3-15

Chen, B.Y., Grandison, A.S. and Lewis, M.J. (2017) Best use for milk – A Review II – Effect of physiological, husbandry and seasonal factors on the physicochemical properties of bovine milk, DOI: 10.1111/1471-0307.12355

Deeth, H.C and Lewis, M.J. (2017) High temperature processing of milk and milk products, Wiley Blackwell

McCance and Widdowson’s, Composition of Foods Tables (5th Edition), 1991, Royal Society of Chemistry, MAFF


Dr Mike Lewis is a recognised academic and has written more than 100 scientific papers, book chapters and textbooks over a period of 45 years. He currently runs food workshops throughout the world and is a consultant to the industry.


Table 1 The pH and composition of bulk raw cow’s milk, taken on 25 occasions over a period of one year (taken from data in Chen et al., 2014)

Compositional Mean+SD Range
pH 6.79±0.35 6.73 – 6.87
Protein ( per cent) 3.29±0.16 2.89 – 3.56
Fat ( per cent) 4.08±0.36 3.62 – 4.77
Lactose ( per cent) 4.59±0.44 4.52 – 4.69
Ash ( per cent) 0.71±0.14 0.53 – 1.03
Total Ca (mM) 29.29±1.78 24.53 – 31.53
Total Mg (mM) 5.11±0.34 4.21 – 5.81


Table 2 Milk production worldwide ( adapted from data in Deeth and Lewis, 2017)

Country and rank order Milk production, 2012

(billion L)

Population

(billion)

Per capita consumption (L/person)
1 USA 90.9 0.318 286
2 India 54.0 1.244 43.4
3 China 37.8 1.364 27.7
4 Brazil 32.3 0.204 158
8 New Zealand 20.0 0.0046 4350
10 UK 13.9 0.065 214
World 620.3 7.25 85.6


Adapted from data in Deeth and Lewis (2017)


Table 3 The cost of protein (pence/g) from different food products, based on price paid and declared protein content

Price (£) Protein content (g/ protein content (g/100 g) Price (p) /g protein
Milk 0.65 /L 3.2 2.03
Soy drink 1.40/L 3.6 3.89
Almond drink 1.50/L 0.5 30
Coconut drink 1.40/L 0.2 70
Rice drink 1.40/L 0.1 140
Oat drink 1.40/L 0.8 17.5
Baked beans 50p /can 4.8 2.55
Mince beef 5£/kg 18.8 2.78
Rump steak 15£/kg 18.9 7.93
Cod £8/kg 17.4 4.60
White bread 800 g/ 1£ 8.0 1.56
Eggs 6 eggs/£ 12.5 2.64


Table 4 Nutrient content of milk powdered and some dried ingredients used in plant protein beverages taken from McCance and Widdowson’s Composition of Foods Tables

Material Moisture

( per cent)

Protein

(g)

Fat

(g)

Carbohydrate

(g)

Ca

(mg)

Mg

(mg)

Na

(mg)

K

(mg)

I

(µg)

Milk Powder* 5.0 24.9 30.3 37.4 895 86 1090 895 117
driedsoyabeans 8.5 35.9 18.6 15.8 240 250 5 1730 6
Dessicated coconut 2.3 5.6 62.0 6.4 23 90 28 660 3
Flaked almonds 4.2 21.1 55.8 6.9 240 270 14 780 2
Hazelnut 4.6 14.1 63.5 6.0 140 160 6 730 17
Oat (meal) 8.2 11.2 9.2 66.0 52 110 9 350 N
Rice (brown) raw 13.9 6.7 2/8 81.3 10 110 3 250 N


Related content

Leave a reply

Dairy Industries International